Return

Start with bVision

bmoves

Thanks to bVision, you can visualize every interventions done by you and your team directly on a map. bVision is our web-based visualization tools available on every modern browsers. We recommend using Firefox, Opera, Chrome and Edge (version 80 and higher).

You want to visualize interventions directly from your smartphone, anywhere, anytime? No problem, you can download our mobile application RWIS, available for Android and iOS.

You can use the same credentials to sign in bVision and RWIS as for our other tools like bMoves app, bAdmin or bConfig. If you are using bVision or RWIS in the behalf of your organization, contact your administrator to get your credentials. Otherwise, you can always create yourself a free account.

1. Live interventions visualization

In bVision, you can visualize every live interventions currently carried by operators within your organization.

To visualize a live operations, open bVision on the map view. On the side-bar grey menu, click on the person icon. This will open the side menu listing all live interventions. This list features an overview of all live interventions with the following informations :

  • Operators : Display the main operator of the interventions. If you hover the name, all operators including co operators and helpers will be displayed in a pop-up.
  • Starting time : Below the operator name, you can find the time at which this intervention was started
  • Current activities : Colored according to your organization's settings, you will find the activities currently carried by this operator. If no activities are currently carried on, one of our two statuses will appear, "Standstill" means the operator is currently not moving and "Patrolling" means the operator is currently moving but not performing any activity. 
  • Travelled distance : Is the total distance travelled during this intervention.
  • Vehicle in used : Display the vehicle currently used during this intervention.
  • Branch : Display the branch to which this intervention is attached, according to your settings.

By clicking on one intervention, you will display it on the map and open it the complete details about it. Section 3 and followings outline how to use the detail panel and the intervention view.

2. Past interventions visualization

With bVision, you can visualize any past interventions up to 10 years in the past with a Pro plan. Please refer to your subscription to know for how long interventions are available. You can visualize past interventions using two methods:

  • Time machine : Click on the date displayed left in the upper menu. By using our time machine, you can then navigate to any point in the past. Just select the date and time you want to visualize and click on "Set" to set bVision date and time to the one selected. Everything, you visualize are now for this time and date. To get back live, open this menu again and click on the white "Clear" button.
  • Interventions : Click on the clock icon in the grey side-bar menu to open the intervention panel. With this panel, you can visualize every interventions within a selected time range. To select a time range, click on the "time range" select. You can then choose either one of our pre-defined range starting from the date of your choosing. Or define a custom time range by pressing the "Custom" button on top and select a top start and end time. When your time range is selected, click outside of the select to close it. You can then select several other filters such as branch, vehicle and operator. To do so, just click on the select for the filter you want to edit and select the appropriate options. Once your filter are set, click on the yellow "Search" button. Every interventions are displayed below with the similar information as for the live interventions.

3. Getting details about an intervention

After clicking on an intervention, either a live or past one. A detailed panel is opened. A path on the map is also displayed if the geo-positionning was enabled for this intervention. 

Map path

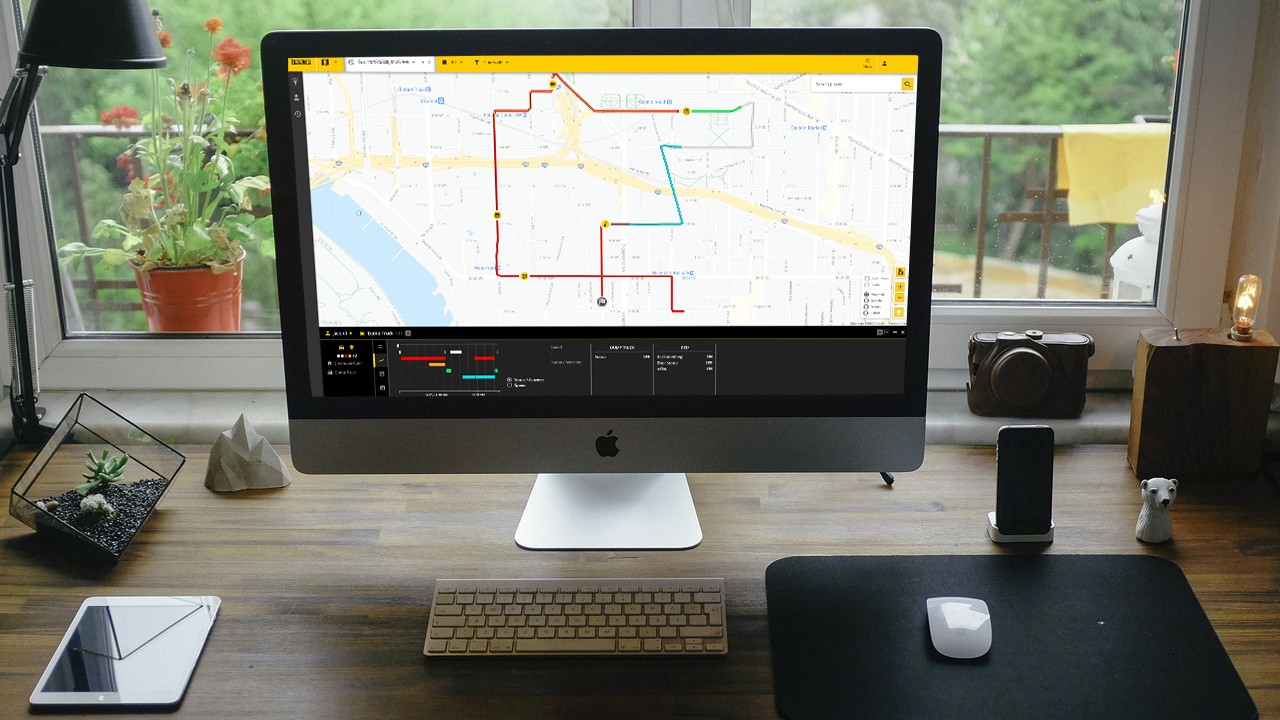
If your geo-positionning is enabled, the path followed during this intervention is displayed on the map. The current position is displayed by a marker, either an arrowhead (when in a vehicle) or two feet (when on foot). Both the path and the position marker are colored according to the ongoing activities. Several scenarios exists :

  • No activities : The path and marker are colored in grey and the status is either "Standstill" or "Patrolling"
  • 1 activity : The path and marker are colored with the color defined for the category of the oingoing activity.
  • 2 activities : The path and marker are colored with the two colors defined for both activities' cateogry.
  • 3 or more activities : The path and marker are colored in black and white to mark that 3 or more activities are currently carried for this intervention.

To gain more information about the situation, you can use your mouse to hover the path or the marker. This will display more information about the situation at the position you are hovering, such as current date and time, speed, travelled distance, ongoing activities and equipment statuses. 

On the map, the cross marks the spot where the intervention started and a chequered flag marks the spot where the intervention ended.

Detail panel

In the bottom of your screen, you can see an information panel. This panel outlines everything you need to know about an intervention. On the left section, you have the operator, vehicle, a summary of all activities carried out during this intervention and the branch to which this intervention is attached.

Moving right, you then have several menus, the first menu (a list icon) enable an overview of the intervention with information such as date of the intervention, start time, end time, total duration and travelled distance. On the right, you have a pie chart. This pie chart represents every activities carried out during this intervention divided by the total time of all activities. This enable you to analyse if an activity was carried out during too long or too short.

The second menu (a rising curve), enable you to have graphical overview of the intervention. This panel offers two graphics, a speed graph and a activity graph. The speed graph displays the evolution of the speed of the operator during the intervention. This curve is colored according to the activities carried out at that time. The second graph displays the evolution of activities during the duration of the intervention. By hovering the graph, you can display the situation of the activities and equipment in used at any given time of the intervention. By clicking on the graph, you can lock the view at any point in the intervention.

4. Checking notes and reports

In the details panel, below the overview and graphs, you can see notes and forms submitted during the intervention. The icons only appears if a forms or notes are submitted for this intervention. 

Notes and forms are displayed on map with a yellow circle. If the intervention was geo-localised, the circle is placed on the exact position where the note or the form was taken. To open the note or the form, just click on the yellow circle.

You can view every notes and forms one by one in the detail panel on the bottom of your screen.

  • Notes : By clicking on the speech bubble icon, you open the notes panel. You can use the white chevron < > icons to navigate between notes. To enlarge the image or play the video, click on the media. To close it again, just click outside.
  • Forms : By clicking on the notepad icon, you open the forms. Use the chevron < > icons to navigate between forms. Click on the yellow "Open activity report" button to read the complete form

5. Field visualization with RWIS

Thanks to our mobile visualization app, RWIS, available for Android and iOS, you can visualize live interventions directly from your smartphone. Download the RWIS app from the store. 

To sign in RWIS app, use the menu icon in the upper left corner and then click on login. You can then sign in RWIS in the same way you sign in bVision.

You can view all your active bMoves intervention by clicking on the bMoves tab in the menu. Then click on the intervention you want to visualize. Select the details tab to get information about the ongoing intervention such as operators, date and time, duration and travelled distance. Select the map tab to visualize the intervention on the map. The intervention is colored according to the same rules described above.

6. Public weather stations, traffic informations and meteo radar

Using the options in the bottom right corner of the map, you can tailor your experience. The first icon displaying a pin on the map, allow you to modify what we display on the map, such as hide notes, show all ongoing interventions or remove the coloring of the path and marker.

With the same option, you can also display public weather stations. Public weather stations provide information about the current weather, state of the road and temperature at a precise position. 

Using the last layer icon, you can change the type of map you display. You can choose between map, satelitte, terrain and hybrid layers. You can also display the meteo radar. This radar display the current weather by applying an overlay outlining the type of precipitation. You can also toggle the traffic. This enable you to view the traffic on all roads. 

7. Change options

By clicking on your username in the top right corner, you can access a few options. 

  • About enables you to get more information about bVision. This is useful when you have a problem with bVision and are looking for some help.
  • Settings enables you to change the unit displayed in bVision and the language you are using.
  • Support enables you to get help in case of a problem
  • Sign out enables you to sign out from bVision.

8. Reporting

To generate report about an intervention or about several interventions, you can use our reporting tool. To open the reporting tool, click on the map icon on the top right of your screen and then select reports. You are now on the Reports screen. Read our reporting course for more details about how to create and generate reports.