1. How does the reporting work
bMoves reporting engine enables you to export custom made reports, tailored to your needs and ready to be shared. You can generate reports for one specific intervention or several interventions matching the filters and time range you set.
The engine is based on .xlsx report templates. A .xlsx report template forms the basis for a report. Each time you generate a new report, our engine fills this template with the data of the intervention(s) you exported.
Note that the report template must be uploaded only once. You can then use it as much as you need.
There is two type of reports, single intervention and multiple interventions. With a single intervention report, you can export data about only one selected intervention. This is a quick way to archive results of an intervention or bill your customers. With a multiple interventions report, you can agregate data from one or more interventions. This enable you to export all interventions during a month, all interventions carried by one operator or more.
To create a report you need to follow the next steps :
In this course, we will teach you how to create a report template custom to your needs, upload it in bMoves and generate a report.
2. Working with placeholders
Placeholders are text elements in your .xlsx report templates that our reporting engine will interpret and replace by specific informations about your intervention.
A placeholder always follows the same structure, for example INTERVENTIONS_ACTIVITY_DISTANCE is a placeholder that computes the distance of one or more activities in the current intervention. In your .xlsx report template, you will use this placeholder written like this {{{INTERVENTIONS_ACTIVITY_DISTANCE(156, 259, 302)}}}. The curly bracket {{{ }}} delimits the placeholders, then comes the name of the placeholder, here INTERVENTIONS_ACTIVITY_DISTANCE, the parenthesis ( ) delimits the arguments used for this placeholder. In this case, the arguments are id of your activities. In conlusion, this placeholder will compute the distance of the activities with id 156, 259 and 302 during the current intervention.
A placeholder can be of several types. This type define how much space they will take when the reporting engine computes that placeholder:
- Single cell : With this type, placeholder will only take one cell, i.e. the cell where they are written. For example, the placeholder VEHICLE_NAME write the name of the vehicle for the intervention in one cell.
- Multiple cells : With this type, placeholder will take several cells. They will use as many cells as necessary to display the result based on the arguments and the placeholder you entered. For example, the placeholder EQUIPMENT_NAME write the name of all equipments mounted on a vehicle during an intervention.
- Multiple rows : With this type, placeholder will take several rows. The reporting engine will generate one row per data that needs to be printed. For example, the placeholder ROADS_DURATION write the duration during which the intervention was on the road.
- Multiple sheets : This special types enables you to generate one sheet in your report per element. For example, notes generates one sheet per note there is in this intervention.
Each placeholder belongs to one sheet model. This describe in which sheet you can use them or if they are used for single intervention or multiple intervention reports. The sheet model are :
- Intervention : Placeholder with this sheet model applies to one intervention and enable the computation from data from one selected intervention. They are typically used for single intervention report.
- Mutliple interventions : Placeholder with this sheet model applies to multiple intervention and enable the computation from data from several interventions agregated. They are typically used for multiple intervention report.
- Note : Placeholder with this sheet model applies to sheet generated with the NOTES placeholder
- Activity Report : Placeholder with this sheet model applies to sheet generated with the ACTIVITY_REPORTS placeholder.
- Sheet model are placeholder that can only be used in sheet's name.
The value of each placeholder once the computation has been done can be one of the following :
- Float (meter) : The output will be a value in meter with number after the decimal point possible. For example "125.5".
- Time : The output will be number of hours, minutes, seconds. For example "05:25:23".
- Date/Time : The output will be a time, a date or both.
- String : The output will be a string of character or numbers. For example "Hello World!"
- Float : The output will be a value with number after the decimal point.
- Picture : The output will be a picture.
- Integer : The output will be a value without number after the decimal point
- String/Boolean : The output will be a string or a boolean (true or false).
- Sheet : The output will be a new sheet in your xlsx document
Note that a placeholder has to be in a single cell with nothing else in it.
Download the list of all placeholders for the latest version of all the placeholders you can use.
3. Create a report template
The first step is to open your favorite spreadsheet program, for example Microsoft Excel and create a new empty document.
This section outlines how to create a report template. First you need to select if you want to create a single intervention report or a multiple intervention report.
Using the placeholder, that you can download here, you can customize this report. If you enter a placehoder in a field, this cell will be replaced by the value. Our engine will only replace field with placeholers, so every other fields will remain untouched. That means you can enter your logo, your billing information or anything else you need.
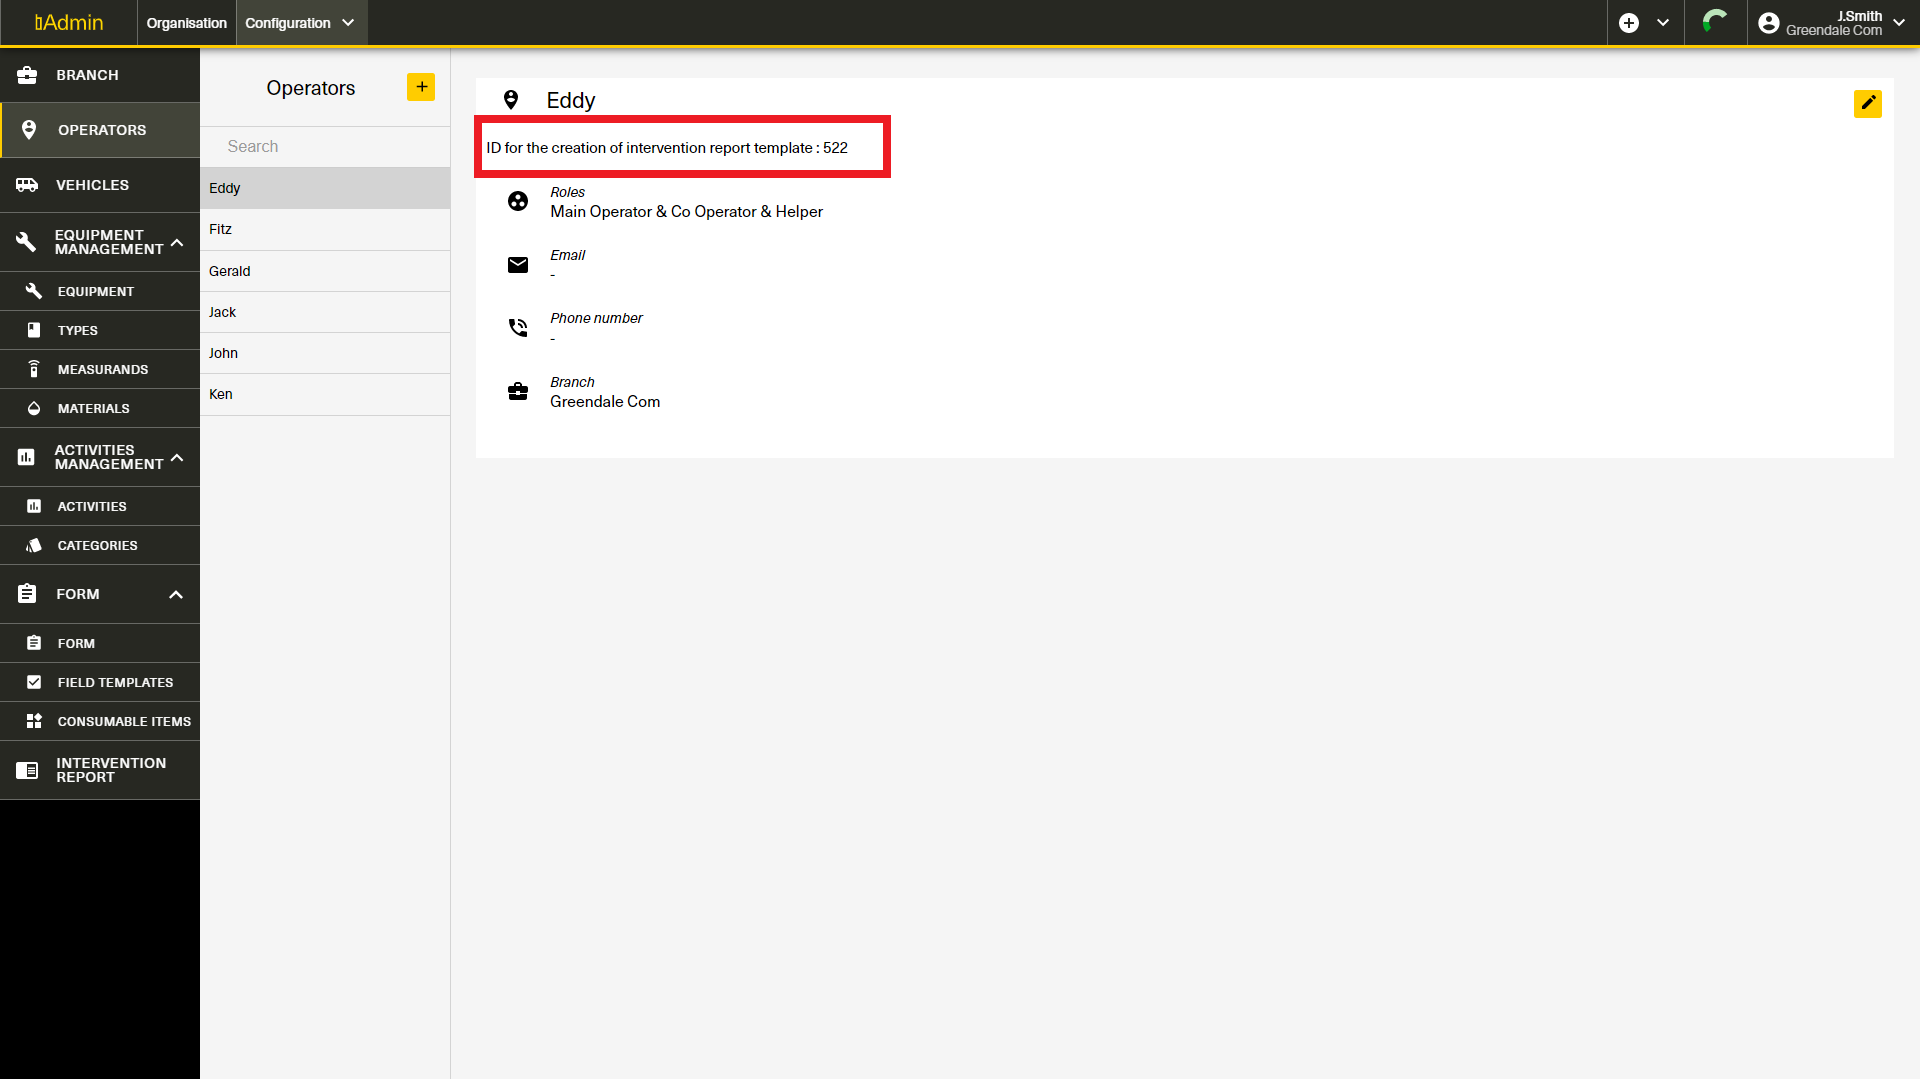
Some placeholder requires an id. This id is specific to your platform. Every bMoves data you create in bAdmin has an id. To get this id, sign in bAdmin in the Configuration section. This id is displayed for every operators, vehicles, equipment, type of equipment, measurement, material, activity, category, form, field template and consumable item. You can get this id on top of your screen directly directly below the name of the selected element. It's displayed next to the "ID for the creation of intervention report template"
Watch the two videos below to learn how to create a single intervention report template and a multiple intervention report template.
Before letting you with the videos, I just want to give you a few tips :
- You can compute values generated by bMoves reporting engine in a formula. To do this, place the placeholder in a cell, then reference this cell in your formula. For example, you can have the distance of the intervention using the placeholder {{{DISTANCE}}} in the cell B5. The placeholder DISTANCE output a value in meter, so if you want to convert it in km, create a formula in the cell B6. To convert the DISTANCE in km, you can enter the formula "=B5/1000".
- Placeholder have to be alone in a cell or the name of the sheet to work correctly.
- Placeholders can be masked. This means that you can hide the row or column where you have a placeholders, for example if you use this placeholder in a formula and only want the result of the formula to be displayed. To do this, right click on the row or column you want to hide and click "Hide"
- Apart for the use of placeholders, you can create your report template as you would for any .xlsx document.
4. Getting report template from the community (and sharing yours)
Sometimes, creating a report template from scratch is not what we want. To help you get the perfect report template suitable for you we built a few things.
First, your platform comes with two pre-built report templates. One for single interventions, one for multiple interventions. You can check those report template directly in bAdmin.
But you can also check our community exchange. That's where our community shares their best report templates. You can download several report template created and shared by the community. Just download the report template that best fits your needs. Once it's downloaded you can customize it has you want. Keep in mind that you have to change the ID in the report template you just downloaded and replace them with your ID (see section 3 for more details on ID).
5. Uploading a report template
Your report template is ready to be used? Perfect. Now you only have to upload your report template in bAdmin :
- Open bAdmin on the intervention report and click on + to add a new report template
- In the box on top named "Field Template", drag your .xlsx report template.
- Then enter a name for this report. The name will help you choose the correct report template later when you generate reports.
- Enter a description for this report template. This description will help you later to know what this report does exactly
- Select the type of the report template, either singleIntervention or multipleIntervention.
- Click on the yellow "Save" button
- Your report template is now online and ready to be used in bVision.
You can also edit an existing report by clicking on the black pen in a yellow button in the top right corner.
6. Generate a report
With your report template uploaded, you are now ready to generate the report you need. To generate a report, sign in bVision and open the reporting tool. In bVision, you can always navigate between the map and the reporting tool :
- Click on the map or report icon in the top left corner (next to the logo).
- In the menu, click on the tool you want to open.
In bVision, you can generate a report using the filters we have created :
- First select a time range. To do this, click on the time range element and either select one of our predefined time range (for example 1 day) and select the end time for that period (for example December 11 2020 at 8:30). With this you will filter only intervention between December 10 2020 at 8:30 and December 11 2020 at 8:30. You can also select a custom time range. For this, press on the Custom on top of the time range pop-up. Then click on the agenda to select a start date and adjust the time. Then repeat the process for the end time.
After selecting your time range and report type, you can then enter select the branch for which you want to export this report.
- Click on the branch element and in the list, select the branch for which you want to generate reports.
After selecting a branch you can press the yellow "Search" button to generate the list of interventions matching your filter.
Before selecting the interventions you want to report, you may want to use more filter. To do so, you have a couple more options.
For Summary report, you can change the List type. List type define how you will agregate data for your report. You have several choices :
- Vehicle aggregates data per vehicle. This enables you to report all interventions done by a specific vehicle during the last month.
- Area aggregates data around a specific area.
- Agent aggregates data per operator. This enables you to report all interventions done by a specific operator during the last month.
- Road aggregates data per road. This enables you to report all interventions that passed on a specific road. For example, to report how many time a road was swept during the last month.
- Road category aggregates data per type of road (pedestrian, local, primary, ...). This enables you to report all interventions done on a primary road during the last month.
Click on the yellow Search button to display the result.
If you selected tour report to report about a specific intervention, you have a couple different options :
- Vehicle enables you to filter intervention done with a specific vehicle
- Operator enables you to filter intervention done by a specific operator.
Note that you can have both filter on. They will then act as an AND. For example, all interventions done by Eddy AND in a Dump Truck.
Click on the yellow Search button to display the result.
You are now ready to generate your report.
- With your filters are set click on the yellow Search button
- Using the toggle box on each intervention (or aggregates) you can select what you want to report. Tick each interventions or aggregates you want to report.
- You can see that your selection appears on the right of your screen in a list. Each elements display a yellow Report available if you can export it in a report.
- Once your selection is complete, press on the yellow Create reports in the bottom right of your screen.
- A pop-up window listing reports that will be generated according to your filters and selection. If you have several templates for this type of report, you can select the template you want to use.
- Click on the yellow Create button to generate and download the reports.
7. Exporting to an ERP
You want to export everything bMoves related to an ERP? You want to synchronize bMoves with your SAP? No problem, our team is here to help you in this process.
Contact us to organize this integration
You don't want to build your report template yourself ? No problem. Contact our sales team. They will help you create the report you need.